Coffalyser.Net displays the results for most probes as a final ratio, but in some cases an intra ratio percentage (also referred to as intra-normalised ratio percentage) may be shown instead. This background article explains the difference between final ratios and intra ratio percentages, and when and how each is displayed in Coffalyser.Net.
Final ratio
Most probes are normalised in two ways: against the reference probes within the sample, and against the reference samples. Normalisation against the reference probes within the sample ensures that absolute signal intensities are converted into relative values, which removes the impact of differences in signal intensities between electrophoresis runs. Normalisation against the reference samples is used to determine whether probe signals in the test samples are different from those in the reference samples.
This results in a final ratio, which represents how different a probe was from the same probe in the reference samples. Because copy numbers of the reference samples are assumed to be known, this allows the determination of copy numbers in the test samples. A final ratio of 1 means that the relative signal was equal to the relative signal in the reference samples. The final ratio is lower if the relative signal was lower in the test sample than in the reference samples, and higher if the relative signal was higher. The table below provides an example for a probe with a normal copy number of 2 in the reference samples.
| Final Ratio | Meaning | Copy Number | Calculation |
|---|---|---|---|
| 0.5 | half the relative height as in the reference samples | 1 | 2 × 0.5 = 1 |
| 1.0 | relative height equal to the reference samples | 2 | 2 × 1.0 = 2 |
| 1.5 | 1.5 times higher relative height than in the reference samples | 3 | 2 × 1.5 = 3 |
Intra ratio percentage
For some probes it is not possible or not meaningful to calculate a final ratio. In such cases, Coffalyser.Net calculates an intra ratio percentage, which is the result of the normalisation against the reference probes within the same sample. The reference samples are not taken into account at all. This is used in the following situations:
- For all mutation-specific probes, as these typically have no signal in the reference samples which means that no final ratio can be calculated (more information).
- For signals ≤ 10% of the median signal of the reference probes in the sample. These signals are considered to be unexpectedly low, and may represent background signals or noise, so an intra ratio percentage is displayed as warning. It is possible to export final ratios for these probes if this is required according to the instructions for use of the application-specific probemix, but this is not recommended in most cases (more information).
- For probes with a signal in the digested reaction of an MS-MLPA probemix but with no signal in the undigested reaction, in which case no final ratio can be calculated. This is an unexpected result but can occur due to noise signals or sample swaps.
The meaning of the intra ratio percentage is different from the final ratio. Importantly, the intra ratio percentage cannot be used do draw conclusions about copy numbers, but only about whether a probe signal is present or absent. An intra ratio percentage only represents how high a probe signal was as compared to the reference probes in that reaction. This value depends on the copy number of the target sequence, but also on the relative heights of probes in the probemix design. The table below provides some examples of how an intra ratio percentage should be interpreted.
| Intra Ratio Percentage | Meaning |
|---|---|
| 0% | no signal |
| 5% | low signal (might be a background signal or noise, depending on the application) |
| 70% | signal present (which happens to be 70% of the median signal of the reference probes) |
| 150% | signal present (which happens to be 150% of the median signal of the reference probes) |
Display of final ratios and intra ratio percentages in Coffalyser.Net
There are two main differences between the display of final ratios and intra ratio percentages in Coffalyser.Net:
- Final ratios are always shown as ratio (e.g. 0.5 or 1.0), while intra ratio percentages are (unsurprisingly) expressed as percentage (e.g. 50% or 100%) to discriminate them from final ratios.
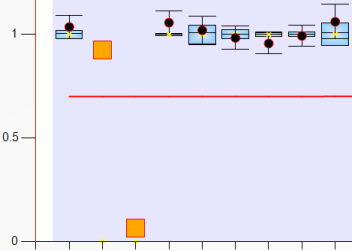
- In ratio charts, final ratios are displayed as dots with confidence intervals, while intra ratio percentages are displayed as orange boxes.
The images below show examples from the ratio chart, a report grid or PDF report. In these examples, the low signal for the third probe may represent a background or noise peak, but this depends on the application.


Summary
The final ratio represents the relative signal as compared to the reference samples, and can be used to determine copy numbers. An intra ratio percentage is calculated when a final ratio is not possible or meaningful, represents the signal as compared to the reference probes in the sample, and cannot be used to determine copy numbers. Coffalyser.Net displays final ratios as ratios and as dots in ratio charts, while intra ratio percentages are displayed as percentage and as orange boxes in ratio charts.
More information about normalisation
For a more detailed, step-by-step explanation of the normalisation process (including visual aids), have a look at our e-learning module about data normalisation.
The Reference Manual contains more details about the calculations performed by Coffalyser.Net, but still includes simplifications. If you would like even more mathematical details, the Coffalyser.Net developers have published a book chapter that describes the normalisation process in much more detail.
