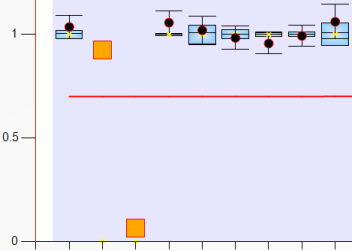
Some probe results are displayed as percentages in grids and PDF reports, and as orange boxes in ratio charts. These are intra ratio percentages instead of the more common final ratios.
Coffalyser.Net mostly calculates final ratios, which are the result of normalisation against reference probes and reference samples. Final ratios are displayed as ratios in grids and PDF reports, and as dots in ratio charts. When the calculation of a final ratio is not possible or not meaningful, Coffalyser.Net calculates intra ratio percentages, which only involve normalisation against the reference probes. Intra ratio percentages are displayed as percentage in grids and PDF reports, and as orange boxes in ratio charts.
Intra ratio percentages are typically used is for mutation-specific probes and for probes with a very low signal ≤ 10% of the median signal of the reference probes. Read more about the differences between final ratios and intra ratio percentages.