Coffalyser digitalMLPA versions v211020.1245 through v251008.1227 have a known limitation with the troubleshooting information displayed in the Reference sample quality (RSQ) sheet in the Ratios.xslx Excel file for probes that target the X- or Y-chromosome outside of the pseudoautosomal regions (PARs). This article describes the limitation and a workaround.
This limitation is no longer present in Coffalyser digitalMLPA v2.5.0 and above. In addition, this limitation only applies to probemixes that have probes for the X- and/or Y-chromosomes. It is only useful to perform the manual calculations described in this article if you use a version before v2.5.0 and have RSQ warnings that may involve X- or Y-chromosome probes. Find which version you have.
Background
Probes that target the X- or Y-chromosome outside of the pseudoautosomal regions (PARs) are normalised to reference samples of the same sex as the test sample. An RSQ warning or error indicates that one or more probes were too variable in the sample population used for normalisation (more information). Because the reference sample population is different for male and female samples for the normalisation of X- and Y-chromosome probes, the RSQ may also differ per sex.
The Reference sample quality sheet of the Ratios.xlsx Excel file is intended to help identify the probe(s) that triggered the RSQ warning or error, and the reference sample(s) that may have contributed most to the variability. This is explained in more detail in this article.
At the moment, the Reference population statistics displayed on this sheet for X- and Y-chromosome probes are only based on reference samples of the sex of the first sample (with the lowest barcode number) included in the analysis. This is a problem for experiments that include both male and female samples. This limitation will be addressed in a future version of Coffalyser digitalMLPA.
Workaround
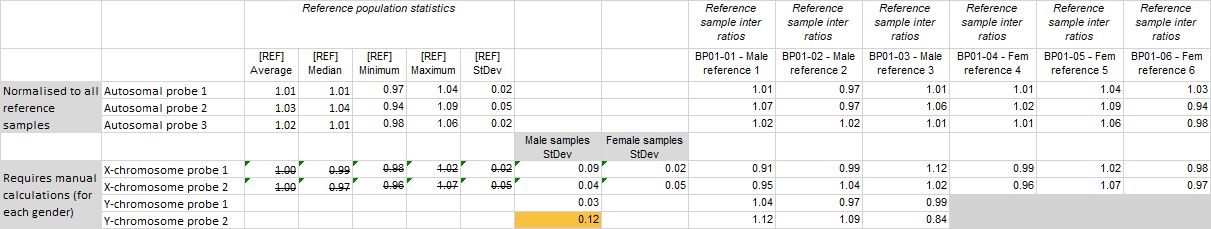
Experiments with dedicated reference samples
You can manually calculate the standard deviation for the male and female samples as follows:
- Open the Reference sample quality sheet in the Ratios.xlsx Excel file.
- Add two extra columns next to the [REF] StDev column in the Reference population statistics section. One of the columns will be used for the male samples and the other for the female samples.
- Calculate the standard deviation of the X- and Y-chromosome probes in the male and female reference samples separately using the Excel function STDEV.P on the inter ratios of the reference samples of the appropriate sex that are shown to the right of the reference population statistics. This is not necessary for probes targeting autosomal or pseudoautosomal regions.
- Check if any of the values is higher than 0.12 (warning) or 0.20 (error) to find the probe(s) likely causing the RSQ warning or error.
Experiments without dedicated reference samples
You can use the same approach as for experiments with dedicated reference samples with one exception: instead of calculating the standard deviation, calculate the median absolute deviation (MAD). This is more complicated than calculating the standard deviation, and involves the following steps for male and female samples separately:
- Calculate the median inter ratio for each X- and Y-chromosome probe (outside of the PARs).
- For each sample and each X- and Y-chromosome probe in the experiment, calculate the absolute difference between the inter ratio and the median from the previous step.
- Calculate the median of the absolute differences from the previous step.
- Multiply this value with 1.4826 to make it comparable to a standard deviation.
- Check if any of the values is higher than 0.12 (warning) or 0.20 (error).